
Can a Whole-Share Basket Replicate a Momentum ETF?
A 100-stock replica tracked SPMO closely. A simulated account targeting its top 20 stocks in whole shares trailed an S&P 500 ETF-based comparison.
If you copy an ETF's holdings, can your own account earn the same return? AlpAI examined two things separately: how closely the ETF alone can be approximated, and what happens when 20 stocks bought in whole shares are built into a simulated account (an account tracked without investing real money, recording the same trades). The replication holding 100 stocks down to fractional shares was close to the real ETF, but the account incorporating 20 stocks underperformed the benchmark.
In this comparison on historical data, the replication did not meet the criteria for adoption. Of the 20 target stocks, the median number actually held was 14, and the drift from the target weights was also large. However, the smaller number of candidates, trading costs, the scaling of account size back through history, and substitute data for older periods are all mixed into the result. It does not show that whole-share buying always loses.
The simulated account is a calculation using historical data. It checks not only stock selection but also allocation drift and costs. An ETF is an investment fund that trades on an exchange.
What was tested
The fund examined is an ETF that tracks the S&P 500 Momentum Index (SPMO). Momentum is the idea that stocks with strong recent price gains tend to stay strong for a while. This index picks stocks with strong momentum from the S&P 500 and holds them at weights equal to company size (market capitalization) multiplied by the momentum score. It is reconstituted twice a year, in March and September.
At the time of the test, the brokerage AlpAI used did not allow purchases of SPMO. So AlpAI tested the question, "If the same idea were built from individual stocks, would it beat holding an ETF that tracks the S&P 500 (VOO)?" against pass criteria set in advance. Individual US stocks can be bought in this account. That was AlpAI's constraint, not a claim about availability in every US account. If your account offers SPMO or fractional shares, your implementation choices differ.
Conditions compared
First, a note on how the figures are kept separate. Result 1 compares annualized returns for the ETFs alone (the replicated series and the real SPMO). From Result 2 onward, the comparison is of annualized returns for the whole simulated account, which includes the protective rule and cash, not the ETF alone. These are shown in separate tables; please do not read them together.
| Item | Condition |
|---|---|
| Period | 2005–2025 |
| Stocks built in | Top 20 stocks, whole shares |
| Rebalancing | Twice a year |
| Trading costs | 0.10% per trade plus $1 per order |
Read details on selection, capital, benchmark and more
Selection
For the 100 stocks selected by momentum score, allocation weights with caps defined in this study were calculated. The 20 stocks with the largest of those allocation weights were taken, and the weights were rescaled to total 100%. The 20 stocks were not chosen by momentum score alone. For older periods, substitute data was used for company size and similar inputs, in line with the conditions under "Period." The allocation weights are built from market capitalization and momentum score, and the cap per stock is the lower of 9% or 3 times its weight among the 100 selected stocks. Rebalanced twice a year.
How shares are bought
At the close on the rebalancing date, divide the target dollar amount by the share price and buy only the whole number of shares, rounding down. The remainder stays in cash. A stock for which not even one share can be bought is not held.
Account size
The current account size, scaled down through history in line with the level of the S&P 500. The smaller the account was in the past, the more likely buying whole shares is to cause allocation drift.
Costs
0.10% per trade, plus $1 per order.
Benchmark
The same capital held in VOO. Because VOO has a period before its listing, this study builds an estimated VOO series by adding 0.065% per year to a dividend-adjusted SPY series, as an assumption. It is not VOO's own actual price series.
Account structure
For comparison, only half of the funds that the simulated account assigned to its core allocation (the central, long-term part of the capital, held in ETFs that track a stock index and similar holdings) was swapped. This is not half of the whole account. The whole account also includes SPY, cash, and a protective rule that acts when the whole account's decline becomes large. Annualized returns from Result 2 onward are for this whole account.
Period
2005–2025. From 2015 onward, the S&P 500 constituents and share counts at each point in time were used. For 2014 and earlier, the composition at the time cannot be restored, so the top 500 stocks by trading value are used as a substitute.
Pass criteria set in advance
Before looking at performance, four pass criteria were set and recorded. The criteria were not changed after seeing the results.
Result 1: The replication method came close to the real SPMO
Before judging the whole account, AlpAI checked whether this way of building the replication can match the real SPMO. A version holding the top 100 stocks, assuming fractional shares can also be bought, was compared with the real fund using monthly moves from 2016–2025.
This table shows annualized returns for the ETFs alone (the replicated series and the real SPMO). They are not whole-account figures.
| Item compared | Annualized return (2016–2025, ETF alone) |
|---|---|
| Replication (top 100 stocks, fractional shares) | 17.41% |
| Real SPMO | 17.92% |
| Difference | −0.51 points |
The correlation of monthly moves (a number showing how similarly the two move) was 0.970. The pass criteria set in advance were "annualized difference within 2 points and correlation of 0.95 or higher," and both were met. Annualized return is the return converted to a per-year rate with compounding; a point (percentage point) is the unit for the difference between two annualized rates.
Result 2: Comparison when part of the account is replaced with the replication
This table shows annualized returns for the whole simulated account (including SPY, cash, and the protective rule that acts when the whole account's decline becomes large), not the ETF alone. Only half of the funds that the simulated account assigned to its core allocation (not half of the whole account) was replaced with the replicated 20-stock strategy (whole shares, current size scaled back through history). That account is compared with one in which the same portion is replaced with the estimated VOO series. These are not VOO's own annualized returns.
All of the following figures are for the whole simulated account. "20 stocks" refers to the replicated set of stocks, and "estimated VOO series" refers to the condition in which the estimated VOO series is placed in the same part of the account. Maximum drawdown is the largest decline from a prior peak.
| Metric / period | 20 stocks | Estimated VOO series |
|---|---|---|
| Annualized, full period | 8.90% | 9.71% |
| Annualized, 2005–12 | 3.60% | 4.58% |
| Annualized, 2013–25 | 12.28% | 12.98% |
| Maximum drawdown | −34.07% | −36.98% |
| Worst year (2008) | −26.14% | −26.80% |
The four conditions set before looking at performance, and how each was judged, are as follows.
- Full-period (2005–2025) annualized return at least 0.5 points higher than the account with the estimated VOO series: −0.81 points, not met.
- Annualized return higher than the account with the estimated VOO series in both 2005–2012 and 2013–2025: lower in both periods, not met.
- Maximum drawdown no more than 3 points deeper than the account with the estimated VOO series: met.
- Worst-year return no more than 5 points worse than the account with the estimated VOO series: met.
The criteria on the size of losses were met, but the criterion on return was not, so the result is a fail overall. The 2005–2012 reading uses the substitute composition described above.
For reference, versions with different numbers of stocks were also calculated. They were not used in the pass/fail judgment. These are also whole-account annualized returns.
The 10- to 25-stock versions use whole shares, and the 100-stock version allows fractional shares. The annualized-return chart shows the whole simulated account's annualized return, and the maximum-drawdown chart shows the maximum drawdown of the same account. The full period is 2005–2025.
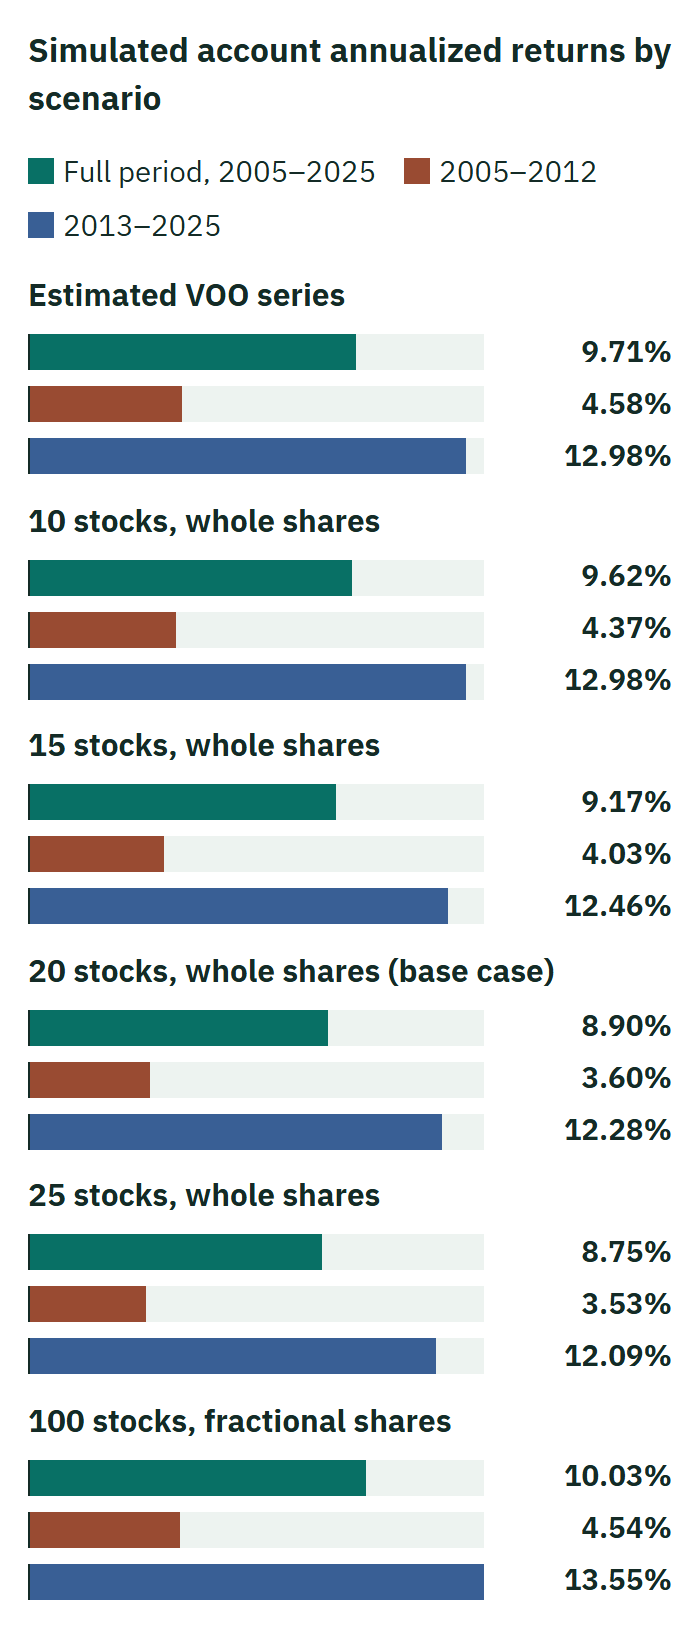
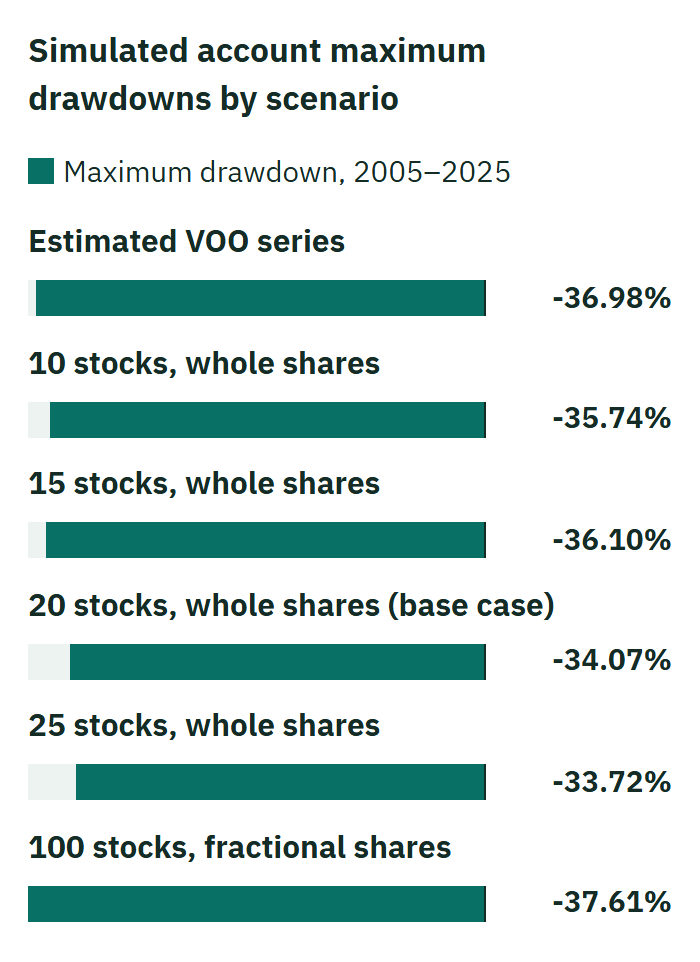
All annualized returns are whole-account figures, in %. They are not annualized returns of the ETF alone.
Why the results did not match
Allocation drifts
Holdings cannot match the target weights. In the base calculation buying 20 stocks in whole shares, the median number of the 20 target stocks actually held at a rebalancing was 14 (minimum 7). "Allocation drift" is the sum, across stocks, of the absolute differences between target and actual weights. Its median at rebalancing was 34% before 2015 and 36% from 2015 on. It is a different measure from the account's loss rate or cash ratio.
For example, if the target is to hold a stock at 5% of capital but one share of that stock costs 7% of capital, you cannot buy even one share. If one share is 2% of capital, two shares make 4%, and the rest stays in cash. The smaller the capital, the larger the effect of a single share's price.
Cash is left over
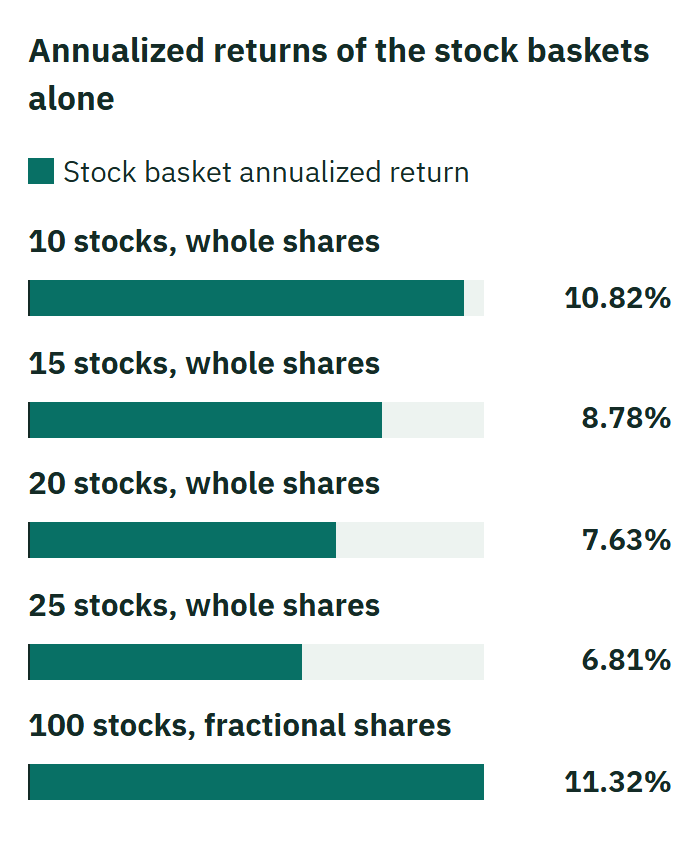
The portion that could not be bought stays in cash. Under these conditions, cash may have held back growth, but its effect cannot be separated from the effects of the number of stocks, costs and substitute data. The annualized returns of the stock set alone, before the account's protective rule is added, are as follows.
Only part of the index can be held
20 stocks capture only part of the index. In the preliminary check, the top 20 stocks accounted for about 69% of the current SPMO's weight. The remaining roughly 30% is assumed not to be held from the start.
Rebalancing costs money
Rebalancing incurs trading costs. The following table shows values measured for the twice-a-year rebalancing.
| Twice-a-year rebalancing (median) | Value |
|---|---|
| One-way turnover | 46% |
| Number of orders | 22 orders |
| Cost per rebalancing | 0.64% of the stock set's value |
Past prices and account size matter
The effect of stocks that were expensive in the past. Because account size was scaled back through history, when a stock whose shares were pricey before a split ranks in the top group, the allocation drift from whole-share buying becomes large. This test was a harsher condition than the preliminary drift estimate based on current prices and account size (about 15% for the top 20 stocks).
Even when fractional shares could be bought, the gap was small. The account incorporating the top 100 stocks with fractional shares had an annualized return only 0.32 points higher than the account incorporating the estimated VOO series (whole-account annualized returns). For 2005–2012 it was 4.54% versus 4.58%, which was lower. With the account's protective rule included, the excess return of the momentum strategy over the strategy using the estimated VOO series was almost entirely gone under these conditions. The whole-share constraint may have worked against it, but the constraint alone cannot be said to explain the gap.
Also, in the 126 trading days from the 2009 bottom, the account incorporating the 20-stock set returned +15.2%, while the account incorporating the estimated VOO series returned +20.3%. The momentum strategy sometimes lagged during market rebounds. This is a reference figure not used in the pass/fail judgment.
What these results cannot tell us
- Older periods use substitute data. For 2005–2014, the top 500 stocks by trading value are used as a substitute, not the actual composition of the S&P 500. Results for this period are not a replication of the index itself.
- The VOO benchmark is an estimated series. Because it includes the period before VOO's listing, the benchmark was built on a study assumption of adding 0.065% per year to a dividend-adjusted SPY series. It is not an independent check of the actual current difference in expenses.
- The scaling of account size is an assumption. Past capital was scaled down in line with the level of the S&P 500. It is not an actual history of the account's capital.
- Confirmation against the real SPMO covers only 2016–2025. Before that, no comparison with the real fund is possible.
- This is the result of one way of building the strategy. It is limited to this combination: 20 stocks, twice-a-year rebalancing, a 9% cap per stock, costs of 0.10% and $1 per order, and the account's protective rule. Changing the number of stocks, the capital, or the rebalancing frequency might change the conclusion. The 10-, 15- and 25-stock versions were calculated for reference only and were not used in the pass/fail judgment.
- It cannot be said that whole-share buying always loses. The account incorporating the top 10 stocks returned 9.62%, nearly the same as the 9.71% of the account incorporating the estimated VOO series (whole-account annualized returns).
- This is not a conclusion that momentum investing as a whole, or investing in individual stocks as a whole, does not work. What was tested here is only a version, under these conditions, that replaces this ETF's idea with 20 individual stocks.
- These are not actual results. Costs and execution prices are assumptions. Actual trading may produce different results.
Points to check when looking at other investment strategies
From this test, here are five points you can also use when looking at the track record of other strategies.
1. Can you hold the same weights with your own capital? Check whether stocks with high share prices are included.
2. Is the result after subtracting costs? The more often a method trades, the larger the effect of costs.
3. Are the benchmark and period the same? Check whether the type of ETF or index being compared and the start and end dates are aligned.
4. Is it a product you can actually buy in your own account? Some US ETFs cannot be bought at certain brokerages. SPMO could not be bought at the brokerage AlpAI uses.
5. Is substitute data being used? If older periods are filled in with substitutes, the results for those periods should be read with a discount.
AlpAI's decision
Because it did not meet the criteria for this test, AlpAI will not adopt this replication.
The basis for this decision is that the return criterion among the pass criteria set in advance was not met. That SPMO could not be bought at the brokerage AlpAI uses was what prompted the question of whether it could be replicated with individual stocks; it is not the basis for non-adoption.
AlpAI will test again when account size or the handling of fractional shares changes in a way that makes it easier to achieve the targeted allocations. A change in conditions alone will not trigger automatic adoption. There is no promise that future stock prices will produce the same drift as this test.
This article presents the results of a calculation using historical data. It does not recommend buying or selling any particular product, and it does not promise future results.