
Did Financially Strong Stocks Beat an S&P 500 ETF?
Financial quality helped rank stocks in historical tests. After costs, corrected portfolio estimates were positive versus an S&P 500 ETF, but both uncertainty intervals included zero.
Does picking companies that earn profits and keep debt low beat a stock index? In U.S. stocks from 2010–2025, company quality (financial strength, measured by the three metrics defined below) was related to the 1-year-ahead return rank. However, there was no evidence that after-cost holding results clearly beat an S&P 500 index ETF (SPY).
This article separates information that ranks stocks well from the profit an investor would actually keep. It reports some results from before and some from after a correction to company identifiers, and it labels which version each figure belongs to. Japanese stocks and actual quality-focused ETFs are also examined separately. All of this is research on historical data.
These results do not show that quality is meaningless. In the pre-correction calculations, the point estimate of the difference in both periods was positive for holding the top quality group equal-weighted versus holding the entire candidate set equal-weighted. However, excess return over the candidate average and an advantage over SPY are separate questions. Market-cap-based weighting, after the company identifier correction, also does not show a clear advantage over SPY. The comparison with large-cap stocks selected without quality is read as an independent test.
Three financial metrics that measure quality
The score used ranks each of the following metrics among the candidates and averages the ranks.
- Net income for the last 4 quarters divided by shareholders' equity: higher is better.
- Debt divided by shareholders' equity: lower is better.
- Year-over-year growth rate of shares outstanding: lower is better.
U.S. financial data come from public SEC filings, using the values that had been filed by the decision date. Each week's candidates are the stocks listed at the time with a price of $10 or more and a 20-day average trading value of $20 million or more. Companies that were later delisted are included.
In the pre-correction Stage 1, the average number of stocks per week for which a score could be calculated was 973 for 2010–2019 and 1,397 for 2020–2025.
Testing rank, holding results, and the large-cap comparison separately
Stage 1 measures the correlation between the score rank and the rank of the stock's gain over the following 250 trading days (about 1 year). The pre-set criteria were that the 95% interval of the correlation be above 0 in both periods and that the top 20% by quality outperform the candidate average.
Stage 2 tests the after-cost results of methods that actually hold stocks. After the Stage 1 result, and before seeing these results, we separately fixed 4 forms and the criteria. Positions are rebalanced once a year, starting capital is $100,000, and commissions and spreads are reflected. Start months are staggered in 12 ways and compared by the median. The criterion is that the 95% interval of the difference from SPY be above 0 in both periods.
Stage 3 compared 50 large companies chosen from the top 20% by quality with 50 large companies chosen from the entire candidate set by market capitalization alone. Both have a cap of 20% per company, trade in single shares, and use the same cost conditions. Before seeing the results, we set as a condition that the quality-screened method beat the comparison in both periods.
Stage 1: Quality and the 1-year-ahead rank had a positive relationship
The tables below and the period-by-period correlations are calculation results from before the company identifier correction. Later recalculation did not change the determination that the criteria were met, but those results are not treated as the same version as the corrected values.
| Period | Stocks per week | Rank correlation at 250 trading days [95% interval] |
|---|---|---|
| 2010–2019 | 973 | +0.056 [+0.044, +0.067] |
| 2020–2025 | 1,397 | +0.109 [+0.087, +0.130] |
| Period | Excess return of the top 20% by quality (difference from the candidate-set average, per year, before costs) |
|---|---|
| 2010–2019 | +1.7% |
| 2020–2025 | +3.8% |
Rank correlation shows whether stocks with higher scores tend to have higher gain ranks afterward. Intervals obtained by resampling in 1-year units to account for overlapping observations also stayed above 0 for the correlation, but this does not mean that individual stocks' gains were predicted.
| Trading days | 2010s | 2020s |
|---|---|---|
| 60 days | +0.024 | +0.049 |
| 120 days | +0.034 | +0.073 |
| 250 days | +0.056 | +0.109 |
In this data, longer periods showed stronger relationships, but this is not a result that can be applied directly to short-term trading.
The excess return of a few percent per year over the candidate average here is before costs. Next, we checked whether results remain as a holding method.
Stage 2: No form clearly beat SPY after costs
Market-cap-based weighting shows results after the company identifier correction. Equal-weighted holdings of the entire candidate set and of the top 20% by quality are shown separately as pre-correction calculation results. Because the input versions differ, results from different versions cannot be subtracted to measure which weighting method is better.
All use $100,000 starting capital, include costs, and are the median of 12 start months. The differences are percentage points converted to an annual rate from the difference in daily log returns, and do not match the subtraction of one annualized return from another.
Gap versus SPY by weighting method: pre- and post-correction results distinguished
Market-cap weighting is the test after the company identifier correction; equal weighting is the pre-correction test. The annualized return of holding the top 20% market-cap weighted was 14.96% in 2010–2019 and 17.08% in 2020–2025.
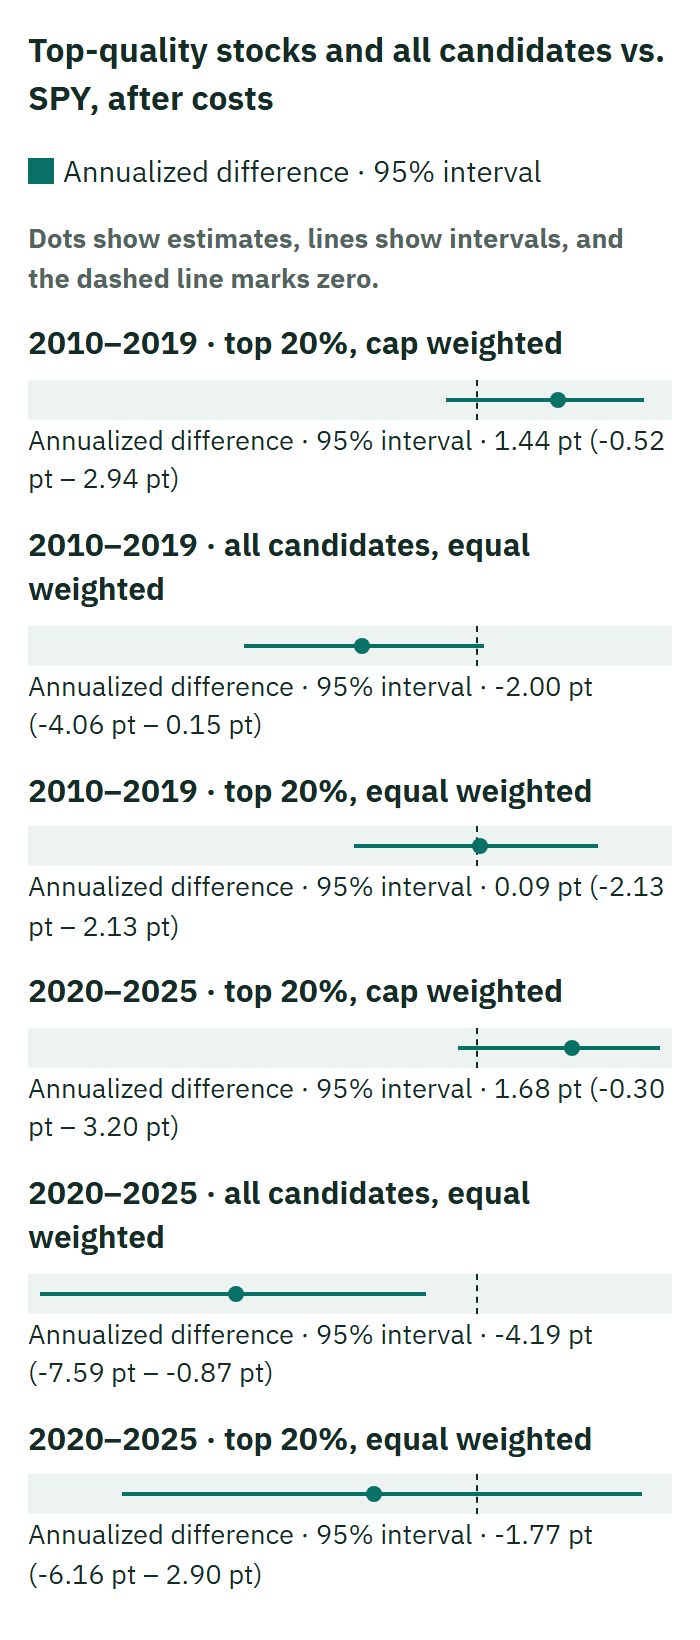
The chart above shows the gap versus SPY. From the corrected values, we cannot say it beat the entire candidate set. The equal-weighted allocation shown alongside uses a different data version and does not make up for this gap.
Equal-weighted allocation: calculation results before the company identifier correction
2010–2019
In the pre-correction equal weighting, the annualized return was 11.06% for the entire candidate set and 13.45% for the top 20% by quality. The entire candidate set is the benchmark when comparing equal-weighted holdings with each other.
2020–2025
In the pre-correction equal weighting, the annualized return was 10.28% for the entire candidate set and 13.03% for the top 20% by quality. The performance gap versus the entire candidate set is shown in a later chart.
For the form holding the top 20% by quality, both the post-correction market-cap weighting and the pre-correction equal weighting had intervals for the gap versus SPY that straddled 0 in both periods. In the original comparison of 4 forms, the other 2 also did not reach the adoption criteria. The form holding the top 50 stocks by quality equal weighted had intervals straddling 0 in both periods, and the form adding persistence of sales growth to quality underperformed SPY by 3.88 points a year in 2020–2025, with an interval also below 0. We therefore do not lump them together as "none of the 4 differed from SPY."
In the pre-correction equal weighting, the point estimate of the difference between the top 20% by quality and the entire candidate set was positive in both periods. However, the interval for 2020–2025 straddles 0. In the same period, the equal-weighted entire candidate set underperformed SPY by 4.19 points a year, so excess return over the candidate average and excess return over SPY are separate questions. The corrected results do not establish whether the market-cap-weighted portfolio clearly outperformed the full candidate set.
Although the post-correction point estimates of the SPY gap for market-cap weighting are positive in both periods, the result depended on a small number of stocks. Excluding the 5 stocks with the largest profits in 2020–2025, the annualized return falls to 7.33%. The maximum drawdown was −21.0% in the 2010s and −33.7% in the 2020s.
Stage 3: No distinguishable performance gap versus 50 large companies chosen without quality
Compared at $100,000 starting capital, in single shares, with costs included. Each annualized return is the median across 12 start months, and each difference is the median of the differences across the corresponding cases. It may differ from subtracting one median annualized return from another.
| Period | SPY | 50 large companies |
|---|---|---|
| 2010–2019 | 13.26% | 12.89% |
| 2020–2025 | 14.93% | 14.83% |
| Period | 50 large companies chosen from the top 20% by quality |
|---|---|
| 2010–2019 | 14.64% |
| 2020–2025 | 14.43% |
The top 2 rows of the chart are results against the entire candidate set under the pre-correction equal weighting. The bottom 2 rows are a separate test: the median of the differences across corresponding cases when comparing 50 large companies chosen from the top 20% by quality with 50 large companies, at $100,000 starting capital, in single shares, with costs included.
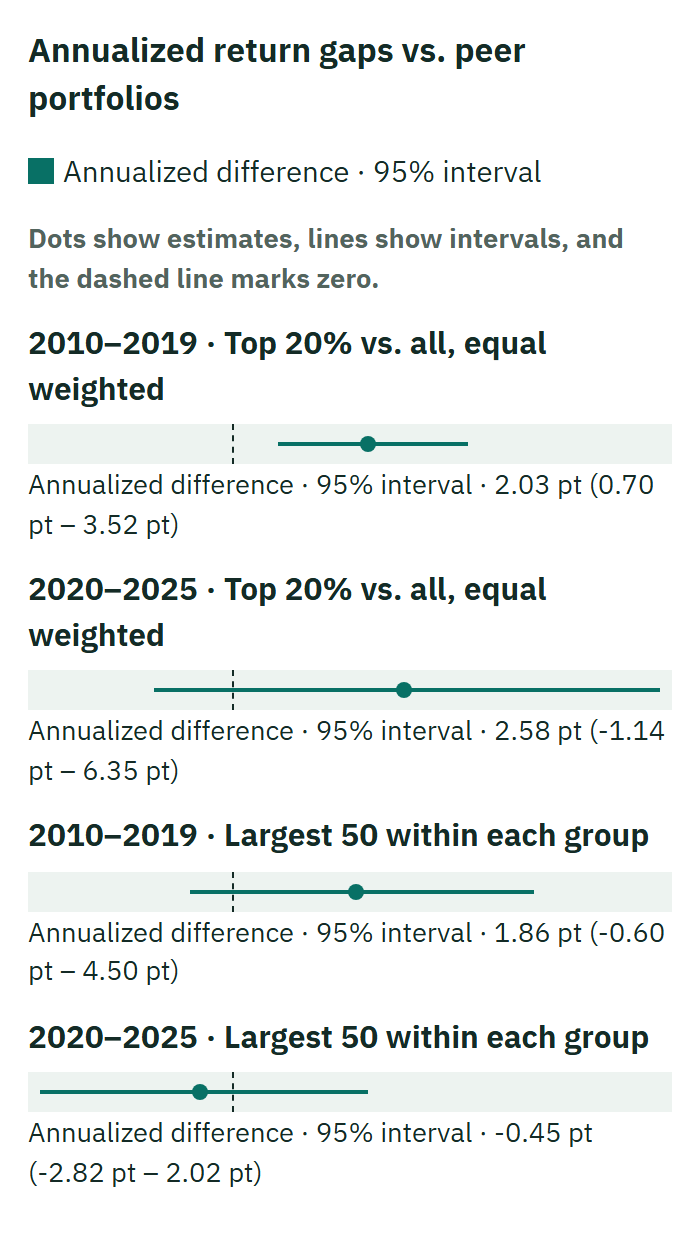
In 2020–2025, selecting by quality was lower, and the pre-set condition of beating the comparison in both periods was not met. With $200,000 in starting capital, the gap in this period is −1.00 points, in the same direction.
The gap versus SPY for the 50 large companies chosen without quality was −0.37 points in the 2010s and −0.09 points in the 2020s, and both intervals straddled 0. The gap between the quality-selected method and the comparison also straddles 0, so we cannot conclude either that the effect of quality is zero or that concentration in large caps explains everything.
How did Japanese stocks and quality-focused ETFs fare?
For Japanese stocks, we built the same three metrics from 37,830 reports of 4,447 companies in EDINET (Japan's electronic disclosure system). The universe is domestic stocks from July 2017 to September 2025 with a closing price of 300 yen or more and a 20-day average trading value of 100 million yen or more, averaging 1,289 companies per week. The relationship to rank is measured using returns after subtracting the same-industry average across 33 industries.
| What was measured | Result |
|---|---|
| Rank correlation at 250 trading days [95% interval] | +0.042 [+0.026, +0.059] |
| 2018–2021 | +0.057 |
| 2022–2025 | +0.020 |
| Within small caps | +0.081 |
| Within mid caps | +0.012 |
| Within large caps | +0.007 |
The correlation met the pre-set pass criterion, but it was smaller than in the U.S. and weakened in 2022–2025. It was especially strong among small caps and only a small relationship among large caps.
As a reference calculation, holding the top 20% by quality equal weighted for 1 year gave the following results across 99 monthly-start sets, with costs included.
| Holding method | 1-year return |
|---|---|
| Top 20% by quality, equal proportions | +10.89% |
| Entire candidate set, equal proportions | +10.43% |
| TOPIX (Japan's broad stock index, with dividends) | +14.20% |
The top 20% beat the entire candidate set in 46 of the 99 sets, and also fell short of TOPIX's result. Information about rank does not by itself become a holding result that beats an index.
Two U.S.-listed quality-focused ETFs were also compared with SPY from each one's listing through October 8, 2026, using dividend-inclusive, after-expense prices. The annual gap was −0.43 points for the one with about 13 years of history and −1.18 points for the one with about 21 years. This is a separate descriptive survey of different subjects, distinguished from additional testing of the methods above.
Detecting a small edge also depends on the length of the data
In the pre-correction Stage 1 result, the rank correlation in the 2020s was +0.109. Meanwhile, the holding methods have not clearly distinguished themselves from SPY. Rank correlation and holding performance are different yardsticks, and besides the difference between the candidate average and SPY, the size of the difference that can be detected also matters.
Beforehand, we estimated that roughly 4 points a year in the 2010s and roughly 8 points a year in the 2020s would be needed to distinguish a difference. The post-correction SPY gaps for market-cap weighting are +1.44 and +1.68 points a year, so at this data length a small effect could be missed. It cannot be read as having "proved there is no difference."
How the research is treated, and what to check when reading other articles
As of October 8, 2026, we could not confirm excess return from selecting by quality in the comparison with 50 large companies, and decided not to use this method in operation. The Stage 1 result is kept only as material for the next research, and no operating rules were changed. Japanese stocks are also outside what we operate and were recorded only as information.
In other research as well, it helps to separate information that gets ranks right from after-cost holding performance, and the difference from the candidate average from the difference from an index. Also check whether results depend on a small number of stocks, and whether there is a comparison of similar size that does not use the feature being tested.
Limitations that narrow the scope of the conclusion
- 2010–2025 is a period already examined in other research. The idea of asking about the long-term effect of quality was also formed after seeing results from a short period, so this is an exploratory result. Confirmation with future data is needed.
- The U.S. universe is limited to liquid stocks priced at $10 or more with trading value of $20 million or more. Stage 1 is before costs and Stages 2 and 3 are after costs, but taxes are not included.
- In market-cap weighting, we fixed an error in which a company's total market capitalization was attached repeatedly to multiple share classes, and then recalculated after also correcting the company identifiers. The annualized return for 2020–2025 changed from 18.60% to 17.12% to 17.08%, but the determination did not change.
- Before the company identifier correction, rows for 2.5% of U.S. candidates in the 2010s and 0.3% in the 2020s were wrong. Recalculation after the correction has been done, but the detailed results labeled "pre-correction" in the text cannot be compared as the same version as the post-correction values.
- For Japanese stocks, we mainly use the second run, which removed price errors for about 10 companies after seeing the first result. The first run's correlation of +0.046 also met the criterion.
- In Japanese stocks, 642 companies with no price data dropped out of the candidates. Of these, 480 had their last report in 2018–2024 and 162 had 2025 as the year of their last report, a mix of delistings, mergers, and changes of listing venue. About half were tender-offer targets. The direction of this omission's effect was not measured.
- Only 2 currently existing ETFs are included, so there is an upward bias from not including closed products.
This research does not recommend buying any particular stock or product. Past relationships and estimates do not guarantee future results.